Example Chart Setting: Creating a Chart by Categorizing the Amount of Product Sales by Product Category and then by Product Name
This article shows how to configure data aggregation conditions for an app that contains product sales so that total sales amounts are calculated by product category and product name, in that order.
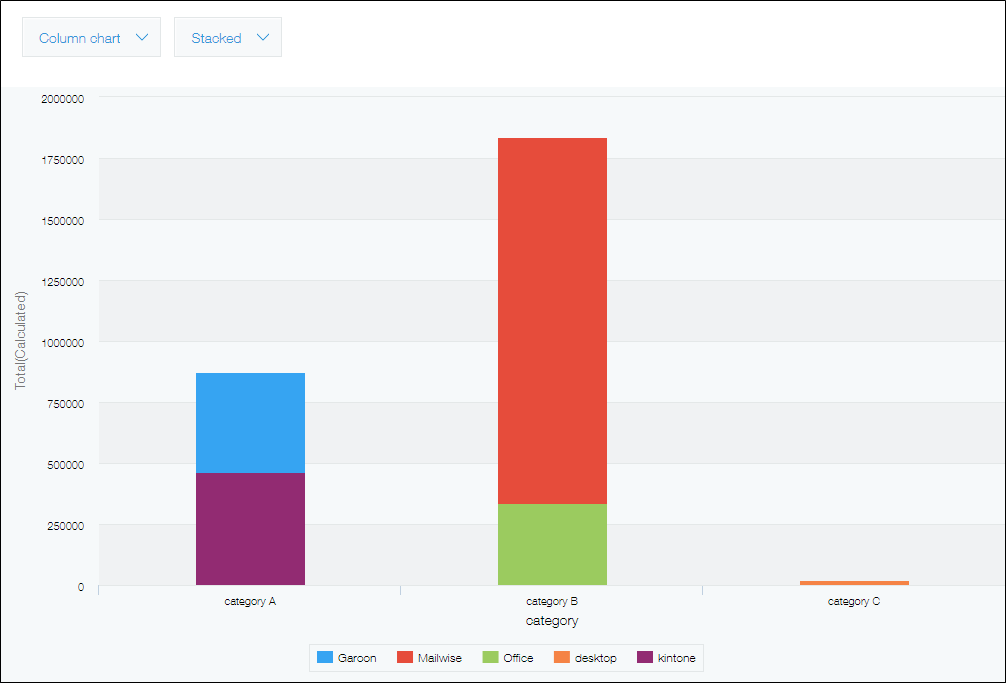
Example of aggregated data:
Fields that need to be configured
Suppose that the app form has the following fields.
- A "Product category" field for entering product categories
- A "Product name" field for entering product names
- A "Sales amount" field for entering product sales amounts
Steps
-
In the graph setting screen, specify each item in "Graph Contents".
- Chart type
Select Column chart and Stacked. - Group by
Select "Product category" for Level 1 and "Product name" for Level 2. - Function
Select Sum and "Sales amount".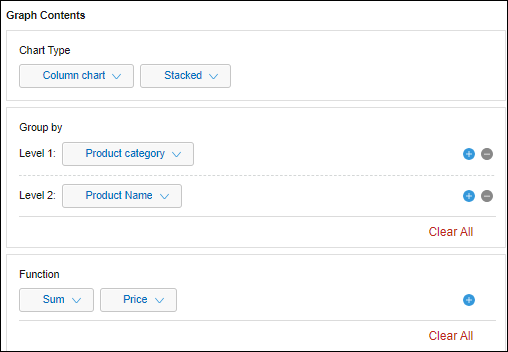
- Chart type
-
Click Save at the bottom right of the screen.