Example Chart Setting: Summing up the Sales Amount for This Month
This article shows how to configure data aggregation conditions to calculate the total sales for the current month in an app that contains product sales data.
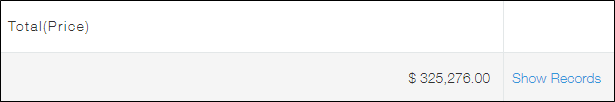
Example of aggregated data:
Fields that need to be configured
Suppose that the app form has the following fields.
- A "Date" field for entering the date of a sale
- A "Sales amount" field for entering a sales amount for the day
Steps
-
On the Graph settings screen, configure the settings under Graph contents.
- Chart type
Select Table. - Function
Select Sum and "Sales amount". - Filter
Specify the following condition:
Date, = (equal), This month, All days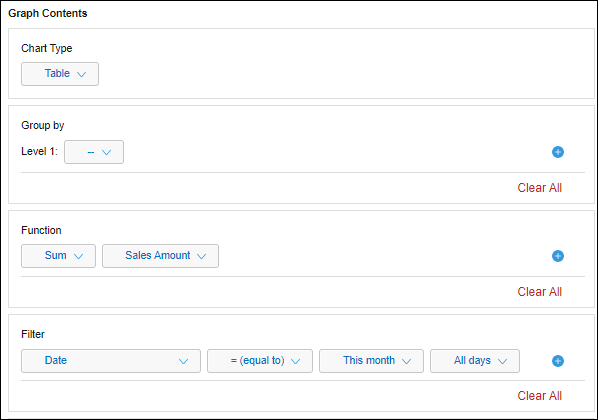
- Chart type
-
Click Save at the bottom right of the screen.
Once the configured aggregation conditions are applied to the app, the aggregated data will be displayed.