Creating Charts on the "App Settings" Screen
If you are an app administrator, you can create charts on the App settings screen and save them in your app. Once a chart has been saved, it can be selected from the app's main page (the View screen) anytime to display the chart with your most recent data.
Up to 1,000 charts can be saved per app.
Creating a chart on the "App settings" screen
Follow the steps below to create a chart on the App settings screen.
-
Click the App settings icon (the gear-shaped icon) at the upper right of the View screen.

-
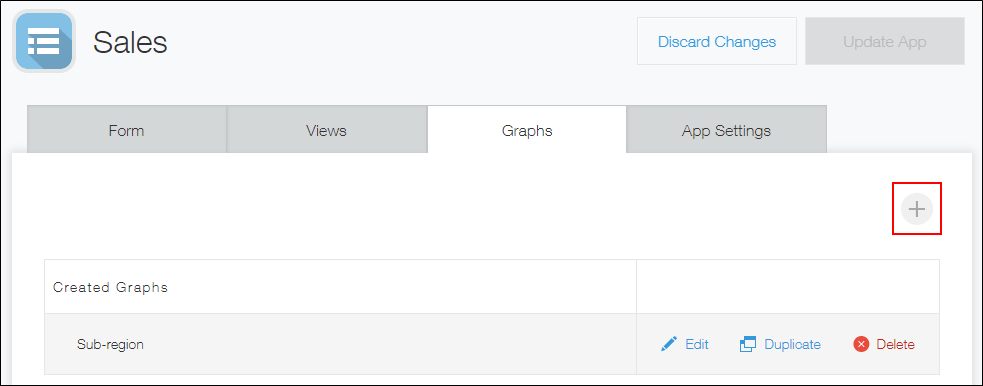
On the App settings screen, click the Graphs tab.
-
Click the Create graph icon (the plus sign-shaped icon) at the right of the screen.
-
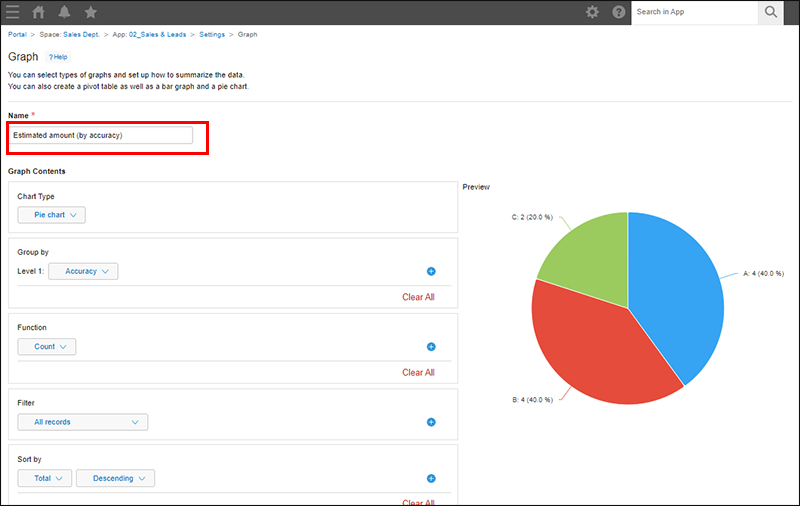
On the Graph screen, enter a name for your chart.
-
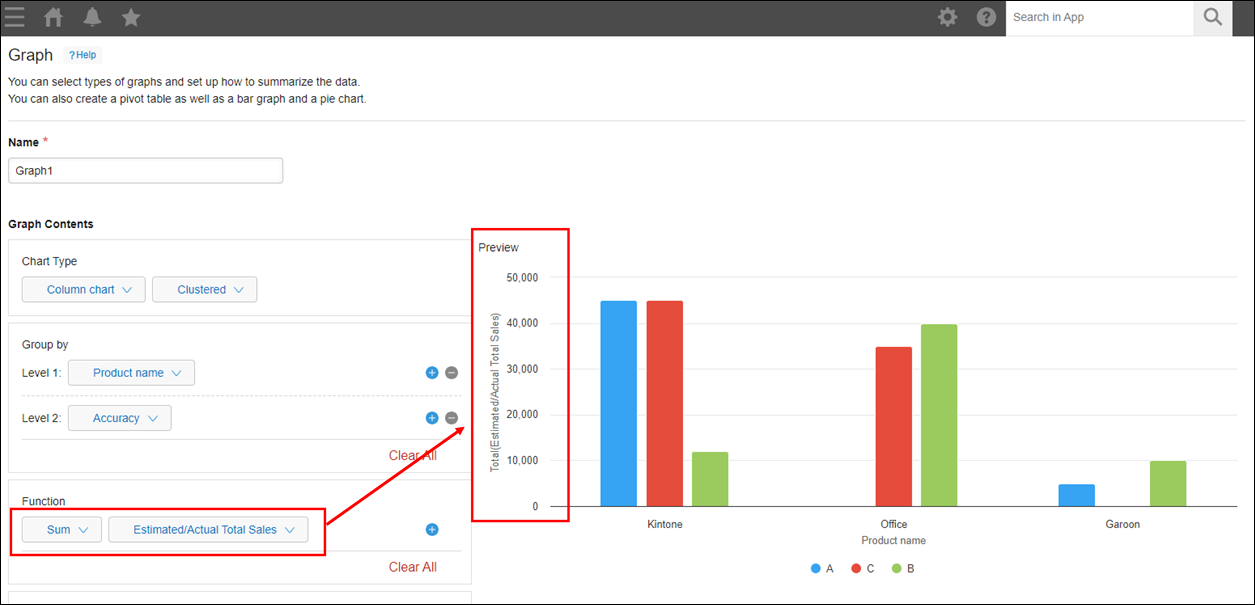
Configure the settings in the Graph contents section.
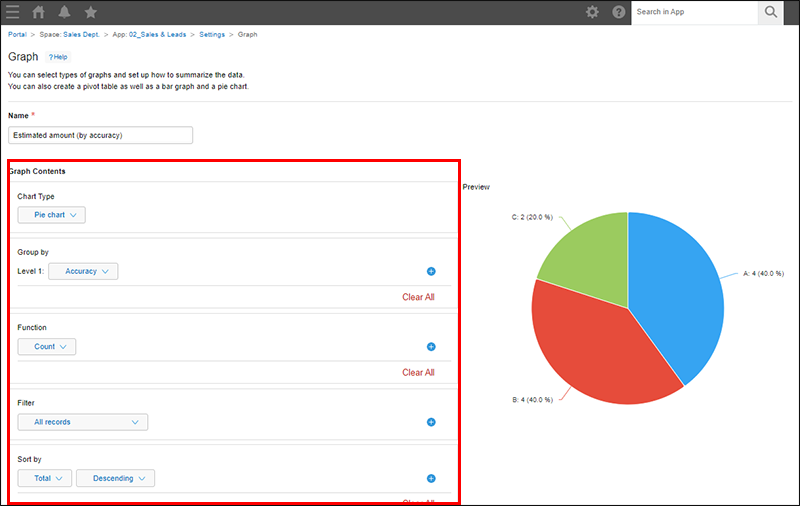
- Chart type
Select how to display your aggregated data. - Group by
If you want to apply grouping criteria for record data, configure the grouping here. - Function
Specify how you want your data to be aggregated. - Filter
If you want to limit the scope of data aggregation to certain records, set filter conditions here. - Sort by
Select the sort order for the aggregated data.
- Chart type
-
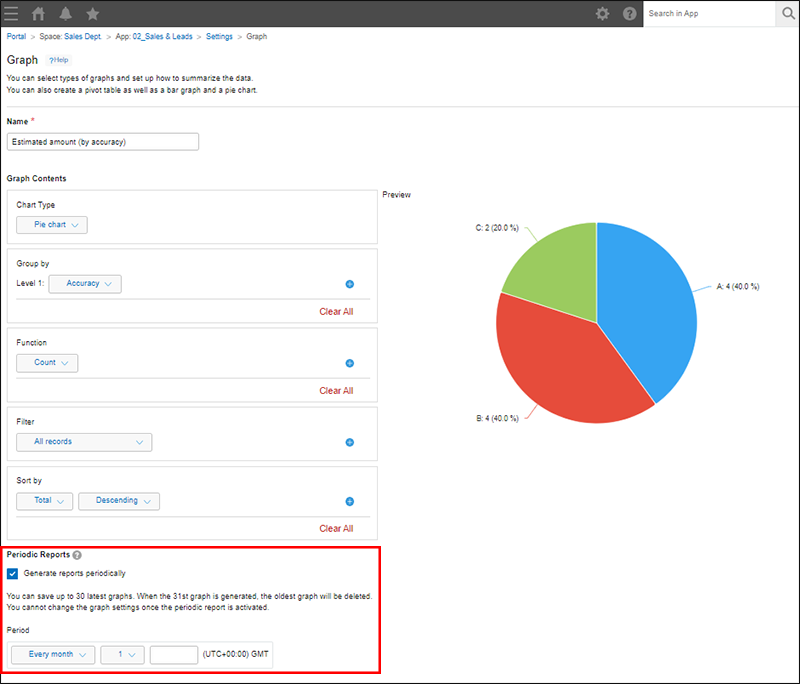
If you want to set up periodic reports, select the Generate reports periodically checkbox and specify the interval for generating reports.
-
Click Save at the bottom right of the screen.
-
On the App settings screen, click Update app.
-
On the Update app dialog, click Update app.
Settings under "Graph contents"
This section explains the settings that can be configured under Graph contents.
Chart type
Select how to display your aggregated data.
Chart types and their usage
If you want to select a pivot table, refer to the following page.
Restrictions applied when "Pivot table" is selected
Group by
If you want to apply grouping criteria for record data, configure the grouping here.
If you select a Date or Time field, you can group record data by month or day.
You can specify Level 1, Level 2, and Level 3. For example, if you create a column chart, the Level 1 item values will be displayed on the horizontal axis and the Level 2 item values will be used as series of data.
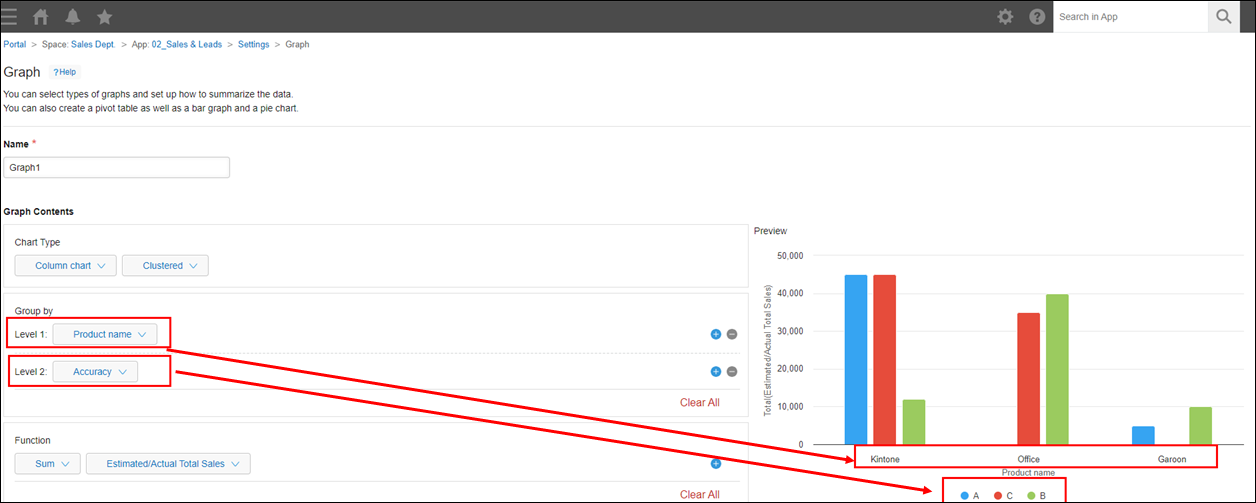
Function
Specify how you want your data to be aggregated.
If you want to find the latest or the oldest records based on the values of a Date and time field, select Maximum or Minimum.
The way your aggregated data is displayed will depend on the configured Function settings. For example, if you are using a clustered column chart, the Function settings will be applied to the vertical axis.
Filter
If you want to limit the scope of data aggregation to certain records, set filter conditions here.
- Notes on using "contains" or "does not contain"
- The difference in the result of filtering when a department is specified as a filter condition for field values
Sort by
Select the sort order for the aggregated data.
If you select Level 1, Level 2, or Level 3, the aggregate result is sorted based on the values of the field set for the selected item.
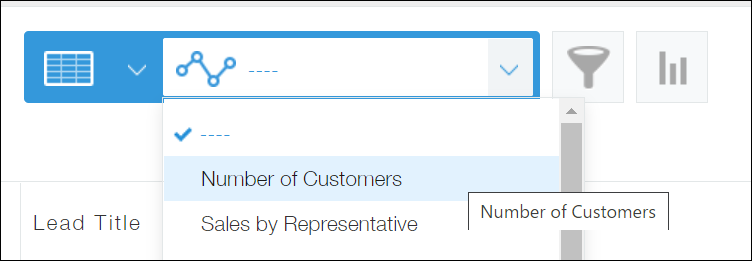
Displaying a chart
-
Click the Graph icon on the View screen.
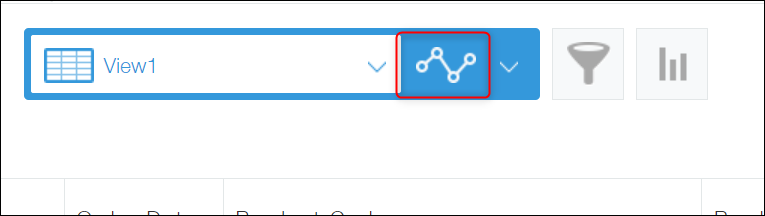
-
Select a chart to display.
Limitations
-
The following limitations apply to the number of records and table rows that can be aggregated.
- Up to 1,000,000 records can be aggregated (in ascending order from the first record number).
- Up to 1,000,000 table rows can be aggregated when aggregating data that includes table fields.
If either of these limits are exceeded, aggregated data will be displayed only up to the limit.
-
If your chart is not displayed, you may be able to check its contents by exporting it to a file.
Also, make sure to keep in mind the following important notes about the options selectable under Chart type.
Table
Only up to 10,001 groups of data can be aggregated using the Group by settings.
If the number of groups exceeds 10,001, the first 10,001 groups sorted by the Sort settings will be displayed or exported.
Pivot table
- Data can be sorted by Level 1, Level 2, or Level 3.
- It is not possible to sort data by Total.
- It is not possible to set up periodic reports.
Displaying aggregated data on your screen
If you want to check your aggregated data on your screen, both of the following conditions must be met.
Otherwise, an error will occur and the aggregated data will not be displayed.
- Only up to 10,001 groups of data can be aggregated using the Group by settings.
- Aggregated data using the Group by settings must fit in 1,000 rows and 50 columns (excluding rows and columns for titles and total values).
Exporting aggregated data to a file
- If you want to export your aggregated data to a CSV file, both of the following conditions must be met.
If either of the following limits are exceeded, aggregated data will be exported only up to the limit.- Only up to 10,001 groups of data can be aggregated using the Group by settings.
- Aggregated data using the Group by settings must fit in 10,001 rows and 50 columns (excluding rows and columns for titles and total values).
- If you want to export your aggregated data to an Excel file, both of the following conditions must be met.
If either of the following limits are exceeded, aggregated data will be exported only up to the limit.- Only up to 10,001 groups of data can be aggregated using the Group by settings.
- Aggregated data using the Group by settings must fit in 10,001 rows and 100 columns (excluding rows and columns for titles and total values).
Other chart types
- When displaying a chart, only up to 500 groups of data can be aggregated using the Group by settings.
If the number of groups exceeds 500, only the first 500 groups sorted by the Sort settings will be displayed. - When exporting to a CSV file, only up to 10,001 groups of data can be aggregated using the Group by settings.
If the number of groups exceeds 10,001, only the first 10,001 groups sorted by the Sort settings will be exported.